Data Analytics In Vaccine Management
Data Analytics In Vaccine Management
Anya Aggarwal, Johns Hopkins University
Abstract
This paper details a computational analysis of a set of HPV (human papillomavirus) vaccination data acquired from pediatric practices in various counties in the United States, within the PediatricXpress databases that are managed and housed by Physician Xpress, Inc. The data shows differences in the vaccination status (vaccinated or unvaccinated) of patients at various practices, that was hypothesized to be tied to demographical factors. Using computational methods involving SQL, machine learning using Python, predictive algorithms and regressions, and statistical analysis, the researchers found patterns of strong correlation among several demographical factors and a patient’s vaccination status. These factors are practice, practice city, practice state, physician, physician gender, patient gender, patient age, patient race, patient ethnicity, presence of Down’s Syndrome, and BMI (body mass index). Using the techniques described in the paper, the authors were able to achieve a model that can predict whether a new patient has been vaccinated against HPV with 93% accuracy.
Background
The HPV (human papillomavirus) vaccine works to prevent the majority of strains of HPV that cause cervical cancer later in life. There are other benefits of this life-saving vaccine that is outside the scope of this paper (CDC). According to the Centers for Disease Control and Prevention (CDC), doctors generally begin to recommend the vaccine to both boys and girls between the ages of 11-12. The ideal window for vaccination is between 11 to 17 years old, but some outliers may receive the vaccine earlier (as young as 9) or older (past 26). Physicians administer the vaccine in a series of either two or three doses every six months, depending upon the age of the patient. However, the HPV vaccine is not legally required for school or by the government, and therefore there exists a higher level of unvaccinated patients regarding the HPV vaccine, as compared to other required vaccines. Understanding and filling the vaccination gap has great potential for growth through research and targeted efforts.
Epidemiology is a branch of study which works to determine causes and patterns that affect health outcomes in populations (CDC). Epidemiologists use systematic, data-driven techniques to analyze patterns and determinants of health-related states in specific populations. Since the practice focuses on specified populations, much of the data used in epidemiological studies, such as the one conducted in the study detailed in this paper, consists of demographical data. Demographics refers to the segmentation of populations based on factors such as age, race, gender, and geographical data (Investopedia). It also includes socio-economic data and provides essential insights into the causes of certain health outcomes. This data can be leveraged to determine insightful patterns among patient data to draw conclusions that improve health systems and public health as a whole.
Machine learning is a computational analytical method housed under ‘artificial intelligence’. Machine learning leverages big data sets to learn and predict outcomes in an efficient manner with little human intervention. The process automates analytical and statistical techniques, and advantageously builds complex but efficient predictive models. This idea of predictive analytics focuses on programming and training systems to predict future outcomes based on learned trends in initial input data. This technique is important in discovering advantageous insights with significant statistical precision that can be used to augment future initiatives in context of the initial data. The following study leveraged machine learning and predictive analytics to determine patterns and detail insights into pediatric patient vaccination status.
Problem Statement
The PediatricXpress electronic medical records (EMR) system contains large amounts of patient data from various pediatric practices around the United States. This data includes information about each patient’s family background, physician and practice information, demographical information, vitals, and vaccination status. This study chooses to focus on relationships that may exist between a patient’s vaccination status regarding the HPV vaccine and the other data information. Looking at the database, superficial analysis makes it clear that there is a difference between the average instance of positive vaccination status among patients from various practices and locations. (Note: positive vaccination status refers to a patient who is up-to-date on the HPV vaccine) This finding lends credit towards the question that this paper explores: are there some definable demographical factors among the patient data, whose patterns can be learned and used to predict HPV vaccination status of future patients?
Methods
Data Preparation – The data used in this analysis, as mentioned above, consists of pediatric patient information from various practices around the United States. This data is stored in PediatricXpress’ EMR database, a cloud-based computing system that is created and run on MySQL. For this analysis, the researchers chose to use Python-based machine learning, utilizing the Jupyter Labs environment. To access the database, therefore, the analysts used a Python package that runs embedded SQL statements in the employ a SQL query within the Python code to create an open connection between the Python kernel and the MySQL database, and allowed for a tunnel of access to the data files in the PediatricXpress system. (Note: database access is password encrypted).
In this study, researchers analyzed HPV vaccination data, and since the HPV vaccine is on average offered after age 12, the researchers chose to filter the patient data by age, only including patients aged 13 to 17 (Note: Age 17 is the cap since this regards pediatric data, and at age 18, persons are not considered “pediatric” anymore). Using the Python-SQL package, the data in question was extracted and loaded into the Python environment.
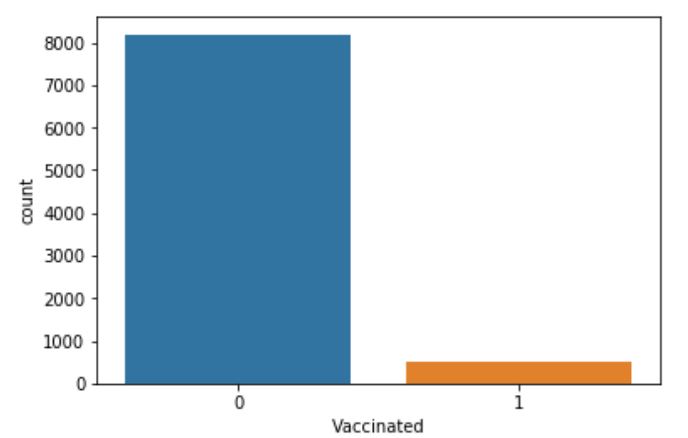
Figure 1: The chart above shows a visualization of the relative counts of patients at the various practices who are HPV vaccinated (denoted “1”) versus who are not (denoted “0”). The difference in the levels lends credit to the specific question this study works to answer.
The purpose of this study is to explicate factors whose patterns of interaction can be used to predict a patient’s HPV vaccination status with high accuracy. Therefore, researchers spent considerable time viewing, cleaning, and extracting data factors that could possibly influence a patient’s vaccination status. The data itself was loaded and viewed using the Python Pandas package, which helps to visualize big data sets in clean tables. The researchers also used Seaborn visualization techniques to further explore whether a factor had potential to correlate with vaccination status, and whether the data could be considered “good”. (Data is “good” when there is a large sample size, distinct categories with well-recorded and maintained data, and minimal noise.) For some factors, the researchers found it necessary to clean the data formatting in efforts to minimize repeat data, correct manual entry errors, augment column readability, and remove null data. This same process was repeated for each of the different patient data tales analyzed as part of the study.

Figure 2: The figure above is an example of the “uncleaned” data. As can be seen, some data points regarding the Physician Gender factor were coded as “unknown” and should not be included in the data used to train and test the final predictive model. The researchers extracted these “bad data points” from the final testable set.
One such table included information about the practices from which the patient data was acquired. After various rounds of data cleaning (with the methods mentioned above), the Practice ID (FK_Practice_ID), Practice City, and Practice State proved to contain “good”, usable data for the study. The analysts also looked at patients’ preferred physician data, resulting in the following usable factors: Physician ID (PK_Physician_ID), First Name, Last Name, and Gender. Most importantly, the researchers parsed and cleaned data about the patients themselves. These analyses resulted in the following factors: Gender, Race, Ethnicity, Age, and Presence of Down’s Syndrome. The researchers also chose to consider one other factor they felt could serve as a good predictor of HPV vaccination status: Body Mass Index (BMI). However, this data is not readily available in the PediatricXpress database, and therefore requires more data manipulation.
In order to obtain BMI data, the researchers extracted height and weight data from the vitals database, and calculated BMI for each individual patient using the following formula:
BMI = 703 (weight/ (height ** 2))
Once all the data was cleaned and joined into a single “master table”, the researchers commenced exploring patterns, and developing algorithmic models to predict HPV vaccination status.
When employing machine learning techniques, it is important to consider which of the two types of machine learning (supervised or unsupervised) is better suited to the data set and desired output. Supervised learning is suited to “labeled data” which is data that has distinct y-outputs that train the model and are desired in the predicted results on the test data. Unsupervised learning deals with data that does not already have a known y-output and attempts pattern-based clustering. In general, supervised learning is better and more practical, and in the case of the vaccination data in question, it is the preferred technique. Supervised learning only works on numerically coded sets of data; this means that all data points must be encoded on a numerical scale, despite the original format of the data. Some of the vaccination data is already numerical (ex. Age, BMI), but others need to be encoded in order to carry out proper machine learning methods. In this case, the researchers used a technique called “One Hot Encoding” which makes separate categories for each output of a categorical value (categorical data are non-numerical and non-boolean data) and denotes data which successfully fulfills the output value with a 1, and data that doesn’t with a 0. In this way, all the data is now numerical, whether it started as such originally or not.
At this point, the data is fully cleaned and encoded to be analyzed by machine learning algorithms. The researchers faced another choice when entering the machine learning phase: which type of model and/or regression would best fit the data. Here, the researchers chose to explore a logistic regression model first. Every instance of machine learning requires the same 4 steps: Instantiate the model, Use a “fit” method of the class to train on training data, Use the predict method of the model to create y predictions from test data, Determine the accuracy score. The researchers followed these steps with a Logistic Regression model and determined that the model trained and tested on the data could predict vaccination status based on the given factors with about 0.9421 accuracy. However, other statistical analyses showed that certain conditions had varying amounts of data to train and test on, making the results weighted in favor of certain conditions over others (this is a phenomenon referred to as oversampling). Oversampling leads to natural biases in the predictive data and the model is not as accurate. The model was corrected for oversampling using a Python package called SMOTE (synthetic minority oversampling technique), which increases dataset size by creating minutely adjusted artificial data for the conditions where sample sizes were previously too low. The researchers also corrected for class imbalance effects in which certain classes are unintentionally weighted higher in the representative sample than others. Correcting for these two externalities (through a process called model tuning and high parameter tuning) provides a less biased regression model, bringing the statistical significance down to about 0.8605, but with improved statistical distribution results.
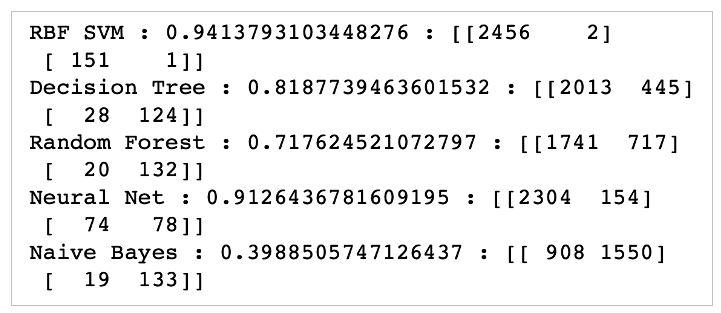
Approach – The data was then trained and tested with a variety of other models (model hyperparameter tuning and cross-validation). These models included Support Vector Machine (SVM), Radial Basis Function (RBF) SVM, Gaussian Process, Decision Tree, Random Forest, Neural Net, and Naïve Bayes (more information about these models can be found online). After conducting model and high parameter tuning to once again minimize oversampling and class imbalance effects, one model clearly emerged as the statistically significant best predictor of vaccination status based on the chosen factors.
Results
The researchers began the machine learning analysis with a logistic regression model as detailed above. The untuned model provided a prediction accuracy of about 0.9421, which indicates high accuracy. However, this model is biased, so after conducting high parameter tuning, the model had a predictive capability of about 0.8605 but with higher statistical distribution results than before. The significant change in accuracy after tuning lends credit to the initiative to cross validate and test other model types for potentially higher predictive accuracy. Out of the tested models (see Methods section), the RBF SVM model showed the highest accuracy, computing with around 0.9413 accuracy.

Figure 3: This figure includes the results achieved by the various models the researchers chose to test. (Format: Model Type: Accuracy Score: Confusion Matrix). It is clear from the results that the RBF SVM (radial-basis function support vector machine) model provided the most accurate predictions.
After conducting further fine tuning and parameter selection for the RBF SVM model, the researchers determined a 0.9333 predictive accuracy, making the model a very good predictor of patient HPV vaccination status.

Figure 4: The result above is the accuracy score for the final, tuned predictive algorithm determined in this study that can be used to predict patient HPV vaccination status based on certain demographical factors with about 93% accuracy.
Conclusion
By the end of this study, the researchers were able to develop a machine learning algorithm that found patterns in the given data about patients and predicted their HPV vaccination status with about 93% accuracy. These results lend credit to the development of a system of improved efficiency in education and physician awareness of under vaccinated populations who should be focused on during physician visits. The accuracy of this technology and the potential impacts it can provide to related questions is immense. For example, similar demographical patient data and analyses can be used to predict whether the patient will pay their co-insurance on time. Other implications of this technology are its use in predicting whether a patient is at risk for diabetes or other illnesses that often go undiagnosed until they have reached a critical stage. It can even be employed in general situations such as asking whether a practice will make money, or how much an insurance provider will pay based on the patient’s reason for visit and previous history. There are countless uses for this type of analysis, and with the rise of big data in healthcare as well as technological computing power, similar studies can be done to spark new research, make practices more efficient, and provide improved patient care.
Sources
https://www.cdc.gov/hpv/parents/vaccine.html
https://www.cdc.gov/careerpaths/k12teacherroadmap/epidemiology.html
https://www.investopedia.com/terms/d/demographics.asp
https://www.sas.com/en_us/insights/analytics/machine-learning.html
https://www.cio.com/article/3273114/what-is-predictive-analytics-transforming-data-into-future-insights.html